Due to the confidential nature of this project, certain details have been omitted.
While working for Helbling Precision Engineering, I was part of a two-person team tasked with developing an automated drug mixing and delivery device. Each of us focued on the development of one concept, ultimately delivering two innovative proof-of-concept (POC) devices to our client, who was very satisfied.
There were two key requirements of this project that created a unique design obstacle.
We utilized a ground-up engineering approach - starting with defining individual device functions, generating ideas for mechanisms that accomplish each, combining these ideas into practical concepts, then preliminarily evaluating these concepts based on the requirements provided by the client (Figure 1). We identified a handful of promising solutions, and ultimately selected two to progress to a POC prototype phase.
The concept I was primarily responsible for developing utilized a compressed gas cartridge and internal valving to mix the drug. Once activated by the user, a complex system of mechanisms enabled a small number of user inputs to achieve the significant number of required device states. With each intermittent button press, the internal mechanism states changed to generate a mixing cycle. The final POC demonstration is shown in Video 1.
Video 1: Demonstration of proof of concept prototype functionality. Device achieved all performance requirements set by client.
Though a prototype, DFMA principles were considered throughout the design, and several COTS parts were utilized as possible. All in all, the development of this concept over a short 5 month period was received exceptionally well by the client, and they ultimately ended up pursiing this concept as their primary development path.
This was the first project that I was responsible for the complete development of a device from idea generation through prototyping. It challenged my understanding of pneumatics and DFMA, and required revisiting many engineering subjects not leveraged since my education. Additionally, with user experience being core to the success of the concepts, I spent a significant portion of the development thinking about not just how to accomplish the mechanical tasks, but also ensuring the use case remained simple and intuitive.
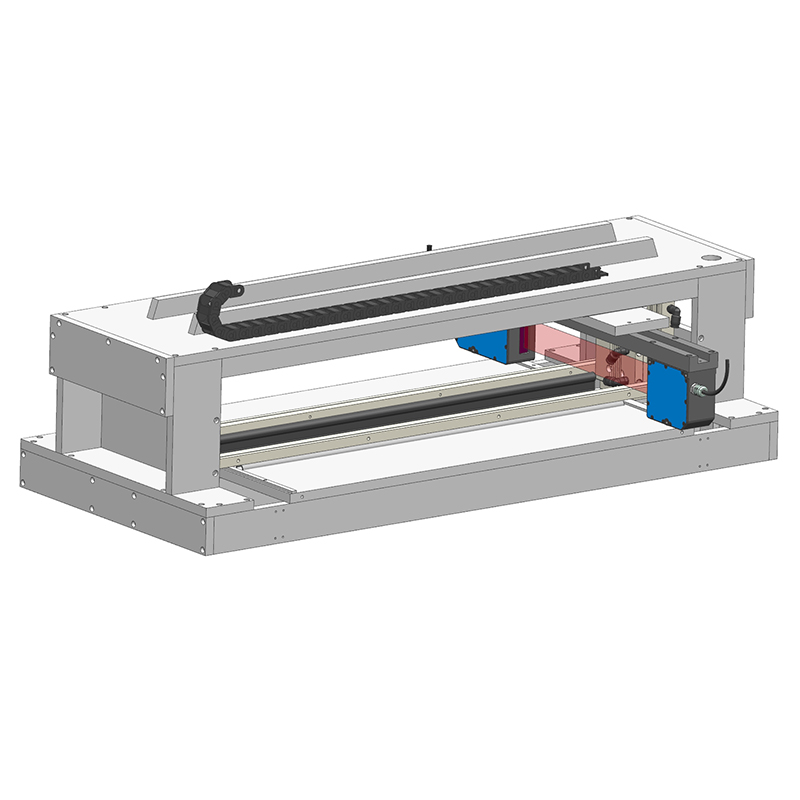
In the winter of 2018, N12 Technologies began earnest development of a wide-format version of their product, NanoStich. However, after transitioning to a large-format substrate, their exisitng quality control systems could no longer analyze the product without extensive sample preparation. As the on-site engineer, I was asked to produce an offline quality control tool capable of measuring the thickness of the product layer on the substrate to within ±5μm. The substrate is a thin foil, and therefore easily flexes.
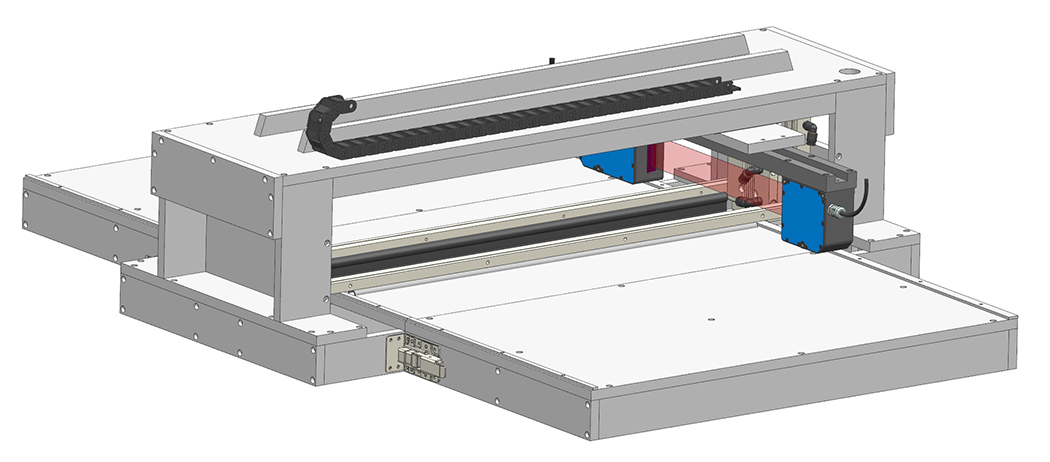
After researching possible technologies, I decided that a rastering laser certain would be an affordable and effective solution. I sourced a linear stage and laser micrometer with acceptable specifications, and began designing a method to fixture the sample. Because the substrate is coated entirely on one surface, and due to process contaminants on the opposite face, measuring the sample non-destructively was not an option. My goal then became reducing measurement time and required operator training as much as possible, without sacrificing measurement resolution. The final design (Figure 1) is capable of measuring any sample up to 24 inches in width, and calculates height data to within ±4μm (validated against SEM date). With slower scans, it was able to consistently calculate data to within ±1.5μm, though I opted to reduce read time over the additional increase in resolution.
Figure 1: Rendered isometric view of height measurement unit.
I opted for a 3-point "tent" fixture, which limits operator setup time while also providing a strong reference surface for the laser micrometer to read. The operator is able to slide a sample in with almost no alignment, actuate the clamp bars down, then the reference bar up. The result (cutaway shown in Figure 2) is a peak in the substrate that generates high contrast for the laser. After rastering the laser once, the operator removes the surface coating and repeats the scan. The processing software (written by my colleague) processes the data delta and generates a height profile.
Figure 2: Cutaway showing 3-point "tent" fixture. Clamp bars circled in green, reference bar circled in blue, and resulting substrate path highlighted in purple.
One note about the design: something this size could have easily been made from a welded frame. However, given time constraints and quoted leadtimes from metalworking shops, I elected to make the design out of flat plates connected by fasteners. I was able to design many of the plates to require only one fixture operations, significantly reducing the fabrication leadtime.
Due to the confidential nature of this project, certain details have been omitted.
During proof-of-concept product development, it became apparent that the coupling mechanism provided to the MAKE Composites design team by their partner was not going to perform adequately for testing and characterizing the performance of their desktop carbon fiber composite additive manufacturing system. As a member of the design team, I began working on an independent design that would be capable of both rapid tool changing, while also having sufficient strength to prevent the held tool from deflecting while engaged. The final product (demonstrated in Video 1) significantly outperformed the predecessor, and enabled the motion system development and characterization to kick off.
Video 1: Demonstration routine showing tool changing speed and repeatability using prototype kinematic coupler.
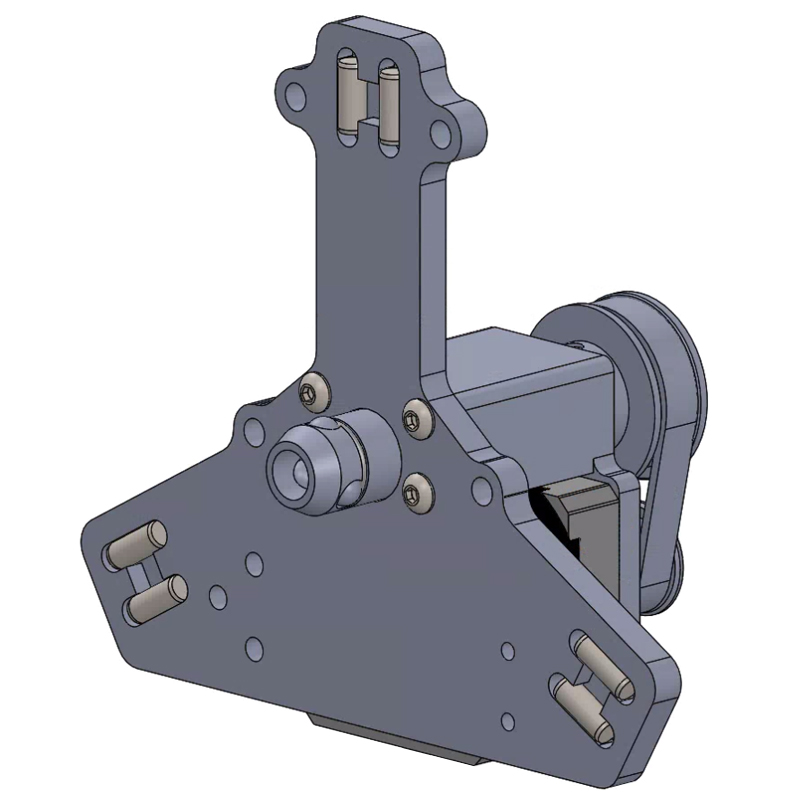
The design utilizes several COTS parts, as well as few custom fabrication parts. The fundamental principle was inspired by a piece of common workholding equipment used to expedite fixture changes in the CNC machining industry. As the tool mates with the coupler shank (Figure 1A), the engagement mechanism is retracted. Once at the full engagement distance (Figure 1B), which is generally set by alignment pins or a limit stop elsewhere on the assembly, the engagement mechanism is actuated, causing a series of hardened balls in the shank to engage a ramp on the tool. Once the balls are fully bound between the members of the shank and tool mating surfaces (Figure 1C), the tool is locked into position by several hundred pounds of clamping force.
Figure 1: A series of schematic cross-section illustrations depicting the engagement process between the shank and tool mating surfaces.
Due to the confidential nature of this project, certain details have been omitted.
In the spring of 2011 an oil well began back-flowing at the surface, in a failure mode referred to as a blowout. All oil rigs are equipped with failsafe hydraulic shutoff values, known as a blowout preventers (BOP), to arrest this type of failure. However, when the BOPs were activated on this rig, the well continued to flow, resulting in an explosion that consumed the rig and well (Figure 1). The resulting damages were claimed for over $5M in losses.
Figure 1: Photographs of the extracted failed safety components.
During the evidence tear-down and document review process, my team determined that certain critical components were replaced by less expensive non-OEM parts. After many years of discussion between the insurance, operating, and well-owning companies, there was no consensus as to whether the BOP failure was due to manufacturing differences between these components, known as packers, or if it was operator error. My team was again retained for an analytical comparative study of the OEM and third-party packers.
Figure 2: CAD model of dissimilar packer plate geometries in Abaqus CAE.
During this process, I was responsibly for inspecting, dimensioning, and modeling the two packer geometries, as well as simulating the BOP activation process with each to determine if the geometric differences had a significant impact in the sealing progressing of the well. The models were a combination of 3D hyperelastic elastomer elements, non-deformable skeletal support geometry, and analytical-rigid surfaces (Figure 2). The results of my simulations showed that the sealing pattern was significantly different and, when compared with the erosion patterns within the subject BOP, were the most likely cause of the well failure. The differences in sealing patterns are shown in Video 1, which has been censored for confidentiality. The video will play the sealing sequence twice, the first to show the progression, the second to emphasize the comparison with the physical evidence extracted from the well.
While this case did go to trial, a settlement was made before the evidence went to deliberation. This outcome was attributed primarily to the analytical analysis performed by myself and my team.
Video 1: Time progression of dissimilar packers closing on pipe. Surfaces not in contact are shown as red, while sealed surfaces are shown as green.
Due to the confidential nature of this project, certain details have been omitted.
In the fall of 2013, multiple high-power electrical transmission tower arms began showing signs of cracking at the weld between the arm and mounting bracket (Figure 1). In some cases, the arm completely fractured from the bracket, leading to hundreds of miles of transmission arms being taken out of service for inspection. Our client retained my group for a comprehensive analysis of the failure, based on wind and arm strain data collected before the arms were removed from service. My role was to review the provided manufacturing and installation documentation, inspect the subject arm brackets, and develop a versatile finite element model to explore our failure mode hypotheses.
Figure 1: Example of failed bracket arm, showing arm separated from bracket at the weld.
Based on the manufacturing design specifications, I modelled the arm and bracket in SolidWorks and imported the geometry to Abaqus CAE. After meshing and boundary conditions, I used the strain data from the previous wind studies to validate my model. My initial results, using a simple static model, suggested that service loads alone could not have caused the premature weld fractures. After a physical examination of multiple subject failed arms, I determined that the spacing between the mounting plates of the bracket was regularly over-tolerance. In addition, I reviewed the field installation notes, which showed inconsistent bolt tightening sequences and torques. To estimate the effects of these pre-service defects, I expanded the static model to include full-contact bolting of the arm to the pole, which I manipulated to consider various arm manufacturing and installation scenarios.
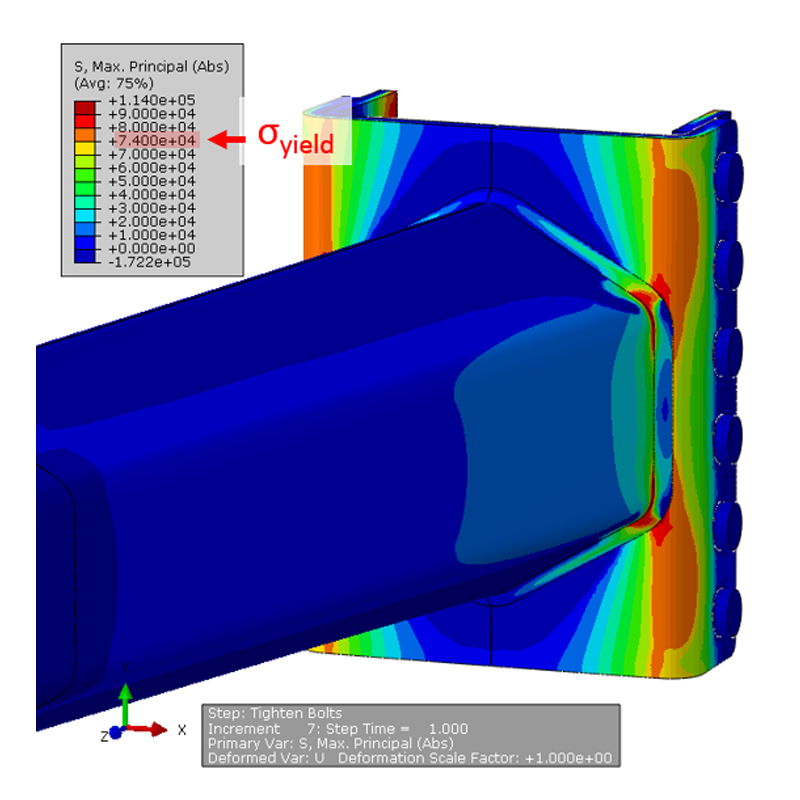
Figure 2: Estimated stress contours resulting from bracket design and installation errors.
My results, shown in Figure 2, demonstrated that with a gap at the maximum design tolerance, smaller than the gap recorded during the inspection, and a correct bolt tightening sequence and torque, the stress in the weld would surpass yield in static conditions. Accounting for the additional effects of cycling dynamic wind loads, I demonstrated that the arm design tolerances would cause the welds to fail by yield and fatigue well before their expected service life. Based on my findings and our full report, our client was able to begin taking corrective action and consider liabilities.
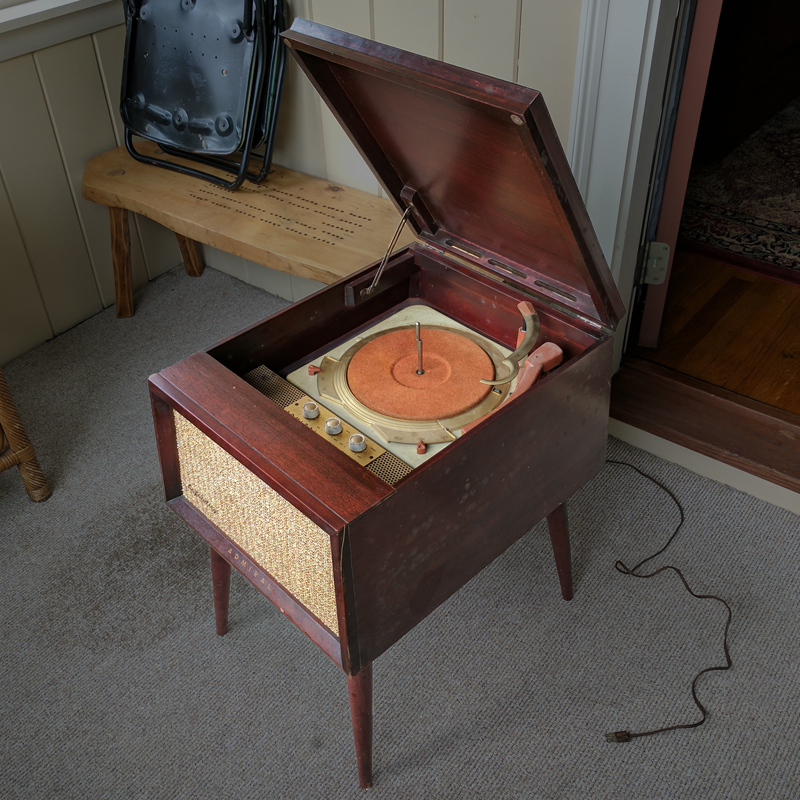
After finding my partner's grandparent's 1956 Admiral Classic 4N2 turntable, I was inspired to restore it to a working condition. I initially planned gut the internal electronics and replace them with the functional components of a more modern turntable. However, after some research I learned this model was one of the original High Fidelity tables produced. In addition, a quick diagnostic inspection found that the internals were in superb condition. After seeing this, I decided to keep everything as original as possible. I ordered some spare needles and tubes from eBay and began looking into restoring the electronics.
Figure 1: Record amp internals. All original capacitors were cardboard with wax.
I had planned to reference the component sizes and ratings from the casings, but overestimated the quality of 60-year-old electronics. I thankfully found a circuit schematic on a radio museum website which I could reference. I considered designing a PCB to simply replace the birds-nest wiring (shown in Figure 1), but I wanted to preserve the antique sound and worried that may drastically alter it. After researching radio refurbishment, I decided to replace all of the capacitors, a select number of resistors, and the power cord. I also elected to install a 5A inline fuse.
Figure 2: After replacing all capacitors and select resistors.
While the record player is now functional (and filling my evenings with Steely Dan), there are still a few more components I would like to repair/replace to improve listening quality. The motor speed is irregular and slightly fast, but could easily be replaced by a modern DC motor and variable PSU. Additionally, the motor-to-table drive mechanism is a thin belt, which has began to harden and elongate. This could likely be replaced with a COTS part.
I will gladly discuss the material and information presented here in greater detail, as well as answer any questions you may have. Please reach out using my contact information below, or simply complete the form and send it on its way.